P-Type Extrinsic Semiconductor

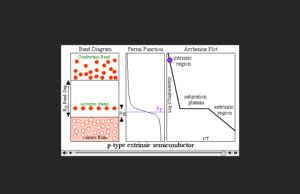
This animation shows band populations as a function of temperature in a p-type extrinsic semiconductor. Note that the Fermi-energy actual shifts position in the band gap and is not accurately depicted here. The video shows the conduction bond and valence bond separated by a band gap with the acceptor states. A graphic display of the Fermi function, and Arrhenius plot of the conductivity log showing intrinsic and extrinsic regions along with the saturation plateau are also shown. This video runs 00:07 seconds in length and is free for download.
About this Resource
Resource Type
Format
Audience
Education Level
Language
Subject
GEM Subject
Subject
Relation
ATE Contributor
Associated Files
Archived
Rights
Access Rights
STEMLink
Available in STEMLink
Comments