Examining Land Use Change in Phoenix, Arizona

Learning Unit Description:
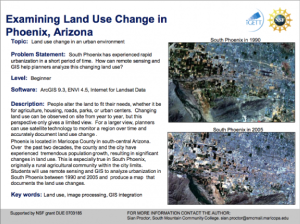
The Integrated Geospatial Education and Technology Training Project (iGETT) presents a series of Learning Units (LU) designed to incorporate federal land remote sensing data into Geographic Information System (GIS) instruction. The Examining Land Use Change in Phoenix, Arizona LU, created by Sian Proctor, uses Phoenix, Arizona and its tremendous population growth over the past as a real-life example that allows students to analyze and compare land use change over time by using remote sensing data and Geographic Information System (GIS) software. According to the lesson, South Phoenix was originally a rural agricultural community within city limits, but soon became the only un-urbanized region within city limits and, as a result, has experienced tremendous land change in order to meet the needs of a growing population.
The iGETT Learning Units amount to about two weeks of instruction and are designed for use both as “skills-based case studies and building blocks for new courses.” All LUs are intended for students with a basic understanding of GIS. Each LU includes three core documents, an instructor’s guide, a student guide, and a curriculum support document, as well as the remote sensing data needed to complete the unit. This short LU should take no more than two 45 minute class periods, or one 1:50 minute lab period, and is designed for introductory-level remote sensing and GIS students. To complete the lesson, students must have access to: a computer lab with ENVI software and ArcGIS ArcView software; Landsat data for 1990 and 2005; internet access; and printed copies of the attached student handout.
Upon completion of the exercise, students will have developed skills in learning how to access Landsat data from GloVis; using ENVI software to create a RGB Landsat image for 1990 and 2005; using ENVI software to create an NDVI; summarizing land use change in South Phoenix and possible environmental consequences by comparing a 1990 satellite image with a 2005 image; and creating a map of South Phoenix using GIS software.
For orientation purposes, viewers should begin with Proctor_Thumbnail.pdf, which offers a description of the LU as well as an overview of topics covered, required software, and the intended audience.
Lesson Contents:
The attached files associated with this activity exist in .pdf format. Below is a list of the files contained in the .zip attachment, with the size of each file in parenthesis.
Proctor.zip
- Lesson Overview (Proctor_Thumbnail.pdf 242 KB)
- Instructor Guide (Proctor_IG.pdf 2.8 MB)
- Curriculum Support Document (LandUse_Proctor_CS.pdf 42 KB)
- Student Handout (Proctor_SH.pdf 12.1 KB)
About this Resource


Comments